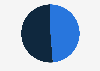
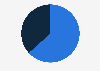
| Characteristic | Male | Female |
|---|---|---|
| 2014 | 51.6% | 48.4% |
| 2015 | 47.9% | 52.1% |
| 2016 | 45.7% | 54.3% |
| 2017 | 44.8% | 55.2% |
| 2018 | 43.8% | 56.2% |
| 2019 | 39.5% | 60.5% |
| 2020 | 38.1% | 61.9% |
| 2021 | 41.2% | 58.8% |
| 2022 | 39.8% | 60.2% |
| 2023 | 38.2% | 61.8% |
The chart is not accessible to screen readers. Please switch to the table view to access the data.
Loading statistic...
Download
Source
Source
Release date
November 2023
More information
Region
Worldwide
Survey time period
2014 to 2023
Supplementary notes
BuzzFeed states that, in addition to collecting gender data in a 鈥渕ale/female/undeclared鈥� format, the company "encourages employees to also complete an additional gender identity field, using an expanded list of options including cisgender, transgender, non-binary, and more." Due to participation rates and sample sizes, the former is used for this report.
Citation formats