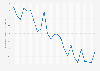
| Characteristic | Food & Drink | Housing | Other goods and services | Transport | Recreation |
|---|---|---|---|---|---|
| Bottom decile | 13.6% | 26% | 35.6% | 7.9% | 16.9% |
| 2nd decile | 13.6% | 27.3% | 32.1% | 9.5% | 17.5% |
| 3rd decile | 12.4% | 24% | 34.6% | 10.6% | 18.4% |
| 4th decile | 12.4% | 20.1% | 34.4% | 13.2% | 19.9% |
| 5th decile | 12% | 21.4% | 33% | 14.1% | 19.5% |
| 6th decile | 11.8% | 20.4% | 33.5% | 13% | 21.3% |
| 7th decile | 11.7% | 18.1% | 34.6% | 15.2% | 20.4% |
| 8th decile | 10.2% | 14.8% | 37.1% | 16.4% | 21.5% |
| 9th decile | 9.9% | 12.3% | 39% | 14.8% | 24% |
| Top decile | 8.1% | 11.4% | 40.4% | 17.1% | 23% |
The chart is not accessible to screen readers. Please switch to the table view to access the data.
Loading statistic...
Download
Source
Source
Release date
June 2026
More information
Region
United Kingdom
Survey time period
April 1, 2024 to March 31, 2025
Supplementary notes
This statistic is using original data from the Office for National Statistics and includes copyright material from 漏 Crown, licensed under the .
Other goods and services include the following spending categories:
Clothing & footwear
Household goods & services
Health
Communication
Education
Miscellaneous goods & services
Other expenditure items
Recreation includes the following spending categories:
Alcohol & Tobacco
Recreation & culture
Restaurants & hotels
Citation formats