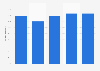
| Characteristic | Percentage of respondents |
|---|---|
| Jun 28, 26 | 60% |
| May 31, 26 | 66% |
| Apr 26, 26 | 79% |
| Mar 29, 26 | 67% |
| Mar 1, 26 | 56% |
| Feb 1, 26 | 59% |
| Jan 4, 26 | 62% |
| Nov 30, 25 | 61% |
| Oct 26, 25 | 63% |
| Sep 28, 25 | 65% |
| Aug 31, 25 | 62% |
| Jul 27, 25 | 59% |
| Jun 29, 25 | 59% |
| Jun 1, 25 | 62% |
| Apr 27, 25 | 72% |
| Mar 30, 25 | 66% |
| Mar 2, 25 | 59% |
| Feb 2, 25 | 56% |
| Jan 5, 25 | 57% |
| Dec 1, 24 | 56% |
| Oct 27, 24 | 53% |
| Sep 29, 24 | 52% |
| Sep 1, 24 | 49% |
| Jul 28, 24 | 45% |
| Jun 30, 24 | 51% |
| Jun 2, 24 | 54% |
| May 19, 24 | 55% |
| May 6, 24 | 58% |
| Apr 21, 24 | 57% |
| Apr 7, 24** | 56% |
| Mar 24, 24 | 48% |
| Mar 10, 24 | 46% |
| Feb 25, 24 | 47% |
| Feb 11, 24 | 46% |
| Jan 28, 24 | 49% |
| Jan 14, 24 | 52% |
| Jan 1, 24 | 49% |
| Dec 10, 23 | 52% |
| Nov 26, 23 | 47% |
| Nov 12, 23 | 52% |
| Oct 29, 23 | 49% |
| Oct 15, 23 | 52% |
| Oct 1, 23 | 54% |
| Sep 17, 23 | 51% |
| Sep 3, 23 | 53% |
| Aug 28, 23 | 51% |
| Aug 20, 23 | 53% |
| Aug 6, 23 | 56% |
| Jul 23, 23 | 59% |
| Jul 9, 23 | 60% |
| Jun 25, 23 | 62% |
| Jun 11,23 | 62% |
| May 29, 23 | 67% |
| May 14, 23 | 67% |
| May 1, 23 | 70% |
| Apr 16, 23 | 70% |
| Apr 2, 23 | 76% |
| Mar 19, 23 | 70% |
| Mar 5, 23 | 71% |
| Feb 19, 23 | 67% |
| Feb 5, 23 | 69% |
| Jan 22, 23 | 67% |
| Jan 8, 23 | 71% |
| Dec 18, 22 | 76% |
| Dec 4, 22 | 74% |
| Nov 20, 22 | 76% |
| Nov 6, 22 | 77% |
| Oct 23, 22 | 80% |
| Oct 9, 22 | 79% |
| Sep 25, 22* | 74% |
| Sep 11, 22 | 87% |
| Aug 29, 22 | 91% |
| Aug 14, 22 | 89% |
| July 31, 22 | 89% |
| July 17, 22 | 89% |
| July 3, 22 | 91% |
| June 19, 22 | 91% |
| June 5, 22 | 88% |
| May 22, 22 | 88% |
| May 8, 22 | 88% |
| April 24, 22 | 91% |
| April 10, 22 | 88% |
| Mar 27, 22 | 87% |
| Mar 13, 22 | 83% |
| Feb 27, 22 | 81% |
| Feb 13, 22 | 76% |
| Jan 30, 22 | 69% |
| Jan 16, 22 | 66% |
| Jan 3, 22 | 66% |
| Dec 12, 21 | 63% |
| Nov 18, 21 | 65% |
| Nov 14, 21 | 62% |
The chart is not accessible to screen readers. Please switch to the table view to access the data.
July 2026
United Kingdom (Great Britain)
November 3, 2021, to June 28, 2026
2,000 to 2,500 per wave
*From September 14-25, 2022 onwards, the source made changes to the survey to measure the short and long-term impacts of the Cost of Living crisis which they believe impacted responses to the survey.聽
**From March 27 to April 7, 2024 onwards, the source removed a question from the survey which is believed to have influenced responses.
More information regarding methodology can be found in the "Notes" tab of the most recent Public opinions and social trends dataset.
聽鈥淭his statistic is using original data from the Office for National Statistics and includes copyright material from 漏 Crown, licensed under the .