| Characteristic | UK | England & Wales |
|---|---|---|
| 2021 | 30.9 | - |
| 2020 | 30.7 | - |
| 2019 | 30.7 | - |
| 2018 | 30.6 | - |
| 2017 | 30.5 | - |
| 2016 | 30.4 | - |
| 2015 | 30.3 | - |
| 2014 | 30.2 | - |
| 2013 | 30 | - |
| 2012 | 29.8 | - |
| 2011 | 29.7 | - |
| 2010 | 29.5 | - |
| 2009 | 29.4 | - |
| 2008 | 29.3 | - |
| 2007 | 29.3 | - |
| 2006 | 29.2 | - |
| 2005 | 29.1 | - |
| 2004 | 29 | - |
| 2003 | 28.9 | - |
| 2002 | 28.7 | - |
| 2001 | 28.6 | - |
| 2000 | 28.5 | - |
| 1999 | 28.4 | - |
| 1998 | 28.3 | - |
| 1997 | 28.3 | - |
| 1996 | 28.2 | - |
| 1995 | 28.2 | - |
| 1994 | 28.1 | - |
| 1993 | 27.9 | - |
| 1992 | 27.8 | - |
| 1991 | 27.7 | - |
| 1990 | 27.7 | 27.7 |
| 1989 | - | 27.6 |
| 1988 | - | 27.5 |
| 1987 | - | 27.5 |
| 1986 | - | 27.4 |
| 1985 | - | 27.3 |
| 1984 | - | 27.3 |
| 1983 | - | 27.2 |
| 1982 | - | 27.1 |
| 1981 | - | 27 |
| 1980 | - | 26.9 |
| 1979 | - | 26.8 |
| 1978 | - | 26.7 |
| 1977 | - | 26.6 |
| 1976 | - | 26.5 |
| 1975 | - | 26.4 |
| 1974 | - | 26.4 |
| 1973 | - | 26.4 |
| 1972 | - | 26.5 |
| 1971 | - | 26.6 |
| 1970 | - | 26.7 |
| 1969 | - | 26.9 |
| 1968 | - | 27 |
| 1967 | - | 27.1 |
| 1966 | - | 27.1 |
| 1965 | - | 27.3 |
| 1964 | - | 27.3 |
| 1963 | - | 27.3 |
| 1962 | - | 27.4 |
| 1961 | - | 27.4 |
| 1960 | - | 27.5 |
| 1959 | - | 27.5 |
| 1958 | - | 27.6 |
| 1957 | - | 27.6 |
| 1956 | - | 27.7 |
| 1955 | - | 27.8 |
| 1954 | - | 27.9 |
| 1953 | - | 28 |
| 1952 | - | 28.1 |
| 1951 | - | 28.2 |
| 1950 | - | 28.2 |
| 1949 | - | 28.3 |
| 1948 | - | 28.5 |
| 1947 | - | 28.7 |
| 1946 | - | 29.1 |
| 1945 | - | 29.1 |
| 1944 | - | 29.3 |
| 1943 | - | 29.1 |
| 1942 | - | 28.8 |
| 1941 | - | 28.7 |
| 1940 | - | 28.8 |
| 1939 | - | 28.9 |
| 1938 | - | 29 |
The chart is not accessible to screen readers. Please switch to the table view to access the data.
Zoomable Statistic: Select the range in the chart you want to zoom in on.
Loading statistic...
Download
Source
Source
Release date
February 2023
More information
Region
United Kingdom
Survey time period
1938 to 2021
Supplementary notes
Data for 1938 to 1990 is for England and Wales only
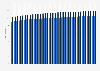
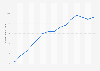
The standardised mean (average) age of mothers at birth is a measure which eliminates the effect of year to year changes in the age-structure of the female population and therefore enables comparisons over time and between countries.
Standardised means are calculated using rates per 1,000 female population by single year of age of mother.
Citation formats