| Characteristic | Rate of reported truancy |
|---|---|
| - | - |
| - | - |
| - | - |
| - | - |
| - | - |
| - | - |
| - | - |
| - | - |
| - | - |
| - | - |
| - | - |
The chart is not accessible to screen readers. Please switch to the table view to access the data.
Download
Source
Source
Release date
December 2016
More information
Region
United Kingdom
Survey time period
2015
Number of respondents
540,000**
Age group
15 years
Supplementary notes
PISA = Programme for International Student Assessment
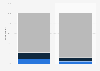
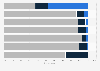
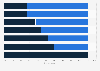
*Rate of truancy in this case refers to the percentage of students who reported that they had skipped a day of school in the two weeks prior to the PISA test.
** Around 540 000 students completed the assessment in 2015, representing about 29 million 15-year-olds in the schools of the 72 participating countries and economies.
Citation formats