
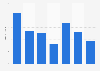


| Characteristic | Share of respondents [NET often/sometimes] |
|---|---|
| Check/respond to e-mails | 58% |
| Use social media | 53% |
| Look up information about what you're watching on TV | 53% |
| Read the news | 50% |
| Play games | 49% |
| Do online shopping | 45% |
| Watch videos | 39% |
| Do online banking | 36% |
| Listen to music or podcasts | 29% |
| Order food | 28% |
| Take pictures / selfies | 22% |
The chart is not accessible to screen readers. Please switch to the table view to access the data.
Loading statistic...
Download
Source
Source
In cooperation with
YouGov
Release date
January 2019
More information
Region
United States
Survey time period
January 15-16, 2019
Number of respondents
556 respondents
Age group
18 years and older
Special properties
Tablet users while watching TV
Method of interview
Online omnibus survey
Supplementary notes
Original question: "How often, if ever, do you do the following activities on your tablet while watching television on a separate device? Please select one option on each row."
Total survey n=1,220
Citation formats





