鹿Previous segment reporting until and including 2018:
- Software, including in-game purchases and subscriptions
- Hardware, including peripherals
虏Segment reporting from 2019 onwards:
- Video Game Content (Physical & Digital Full Game, DLC/MTX and Subscription consumer spending across Console, Cloud, Mobile*, Portable, PC and VR) platforms)
- Video Game Hardware
- Video Game Accessories
Accessories revenue includes controllers.
Citation formats
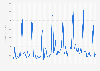
Annual revenue of the U.S. video game industry 2016-2025, by segment
Video gaming content, including mobile gaming apps, accounts for the bulk of the annual video gaming industry revenue in the United States. In 2025, the total revenue of the U.S. video game industry amounted to billion U.S. dollars, a slight increase from the previous year. Overall, the聽monthly revenue of the video gaming industry sees some fluctuation throughout the year, with lows in the summer months, and higher sales during the holiday season.
Going digital and not turning back
Over the last few years, digital gaming sales have been growing slowly but steadily and exploded during the COVID-19 pandemic. Many consumers switched to digital game downloads instead of visiting brick-and-mortar retail locations and did not return to their previous shopping patterns after the normalization of the health emergency. Coupled with the ever-growing availability of high-speed internet connections and the release of the new flagship gaming console generation by Microsoft (Xbox) and Sony (PlayStation), comfort and convenience won over in-store browsing.
Additionally, digital game storefronts across all gaming platforms frequently run sales and special offers that physical retailers rarely match. In 2024, the average revenue per user of physical video game sales in the United States amounted to dollars, similar to the ARPU of game downloads at dollars. Overall, the聽average monthly video game expenditure of U.S. gamers decreased to *dollars in 2023, down from dollars in 2022.
The struggles of the gaming hardware segment
In contrast to the booming digital gaming content sales, the gaming hardware segment did not have an easy time in 2020 and 2021. What was supposed to be a year of triumph with the long-announced release of the ninth generation of video game consoles with the PlayStation 5 and the Xbox Series X/S in November 2020 quickly turned into a tale of woe.
The ongoing global chip shortage, which started in early 2020 due to COVID-19 -related disruptions in global supply chains and logistics, strongly constrained the availability of chips to produce video gaming consoles. Additional factors such as trade wars, increased demand for hardware due to crypto mining, severe weather, and war impacting raw material exports continue to plague the global chip industry to this day. The lack of availability of the new consoles also led to scalpers taking advantage of the situation, leaving a sour taste for consumers.
Console makers managed to turn things around, and while sales of the new consoles were not as good as they could have been, 2022 saw some recovery, and 2023 managed to get console sales back on track, despite global economic worries. In the first eleven months of 2023, Sony managed to sell close to ** million PlayStation 5 consoles, with Microsoft鈥檚 Xbox Series X/S selling about *** million units.
Profit from the additional features of your individual account
Currently, you are using a shared account. To use individual functions (e.g., mark statistics as favourites, set
statistic alerts) please log in with your personal account.
If you are an admin, please authenticate by logging in again.
Learn more about how 糖心破解版 can support your business.
GamesBeat. (January 22, 2026). Total and segment revenue of the video game industry in the United States from 2016 to 2025 (in billion U.S. dollars) [Graph]. In 糖心破解版. Retrieved August 01, 2026, from /statistics/249996/annual-revenue-of-the-us-video-game-industry-by-segment/
GamesBeat. "Total and segment revenue of the video game industry in the United States from 2016 to 2025 (in billion U.S. dollars)." Chart. January 22, 2026. 糖心破解版. Accessed August 01, 2026. /statistics/249996/annual-revenue-of-the-us-video-game-industry-by-segment/
GamesBeat. (2026). Total and segment revenue of the video game industry in the United States from 2016 to 2025 (in billion U.S. dollars). 糖心破解版. 糖心破解版 Inc.. Accessed: August 01, 2026. /statistics/249996/annual-revenue-of-the-us-video-game-industry-by-segment/
GamesBeat. "Total and Segment Revenue of The Video Game Industry in The United States from 2016 to 2025 (in Billion U.S. Dollars)." 糖心破解版, 糖心破解版 Inc., 22 Jan 2026, /statistics/249996/annual-revenue-of-the-us-video-game-industry-by-segment/
GamesBeat, Total and segment revenue of the video game industry in the United States from 2016 to 2025 (in billion U.S. dollars) 糖心破解版, /statistics/249996/annual-revenue-of-the-us-video-game-industry-by-segment/ (last visited August 01, 2026)
Total and segment revenue of the video game industry in the United States from 2016 to 2025 (in billion U.S. dollars) [Graph], GamesBeat, January 22, 2026. [Online]. Available: /statistics/249996/annual-revenue-of-the-us-video-game-industry-by-segment/