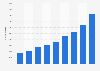
| Characteristic | Health care trend after plan and contribution changes | Health care trend before plan and contribution changes |
|---|---|---|
| 2023 | 6% | 6.2% |
| 2022 | 5% | 5.2% |
| 2021 | 5% | 5.6% |
| 2020 | 1.5% | 2.6% |
| 2019 | 3.7% | 4.1% |
| 2018 | 4% | 5% |
| 2017 | 4% | 5% |
| 2016 | 4.4% | 6% |
| 2015 | 4% | 5% |
| 2014 | 4.9% | 6% |
| 2013 | 4.2% | 6% |
| 2012 | 5.5% | 6.8% |
| 2011 | 5.5% | 8% |
| 2010 | 6.8% | 8% |
| 2009 | 6.8% | 8% |
| 2008 | 5.3% | 8% |
| 2007 | 6.4% | 9% |
| 2006 | 8.3% | - |
| 2005 | 9.2% | - |
| 2004 | 11.3% | - |
| 2003 | 13% | - |
| 2002 | 14.7% | - |
| 2001 | 10.3% | - |
| 2000 | 9.7% | - |
| 1999 | 7.5% | - |
The chart is not accessible to screen readers. Please switch to the table view to access the data.
January 2023
United States
1999 to 2023
455 employers
U.S. employers with at least 100 employees
Data from multiple reports.
Respondents collectively employ over 5.9 million full-time employees and operate
in all major industry sectors.
A company鈥檚 medical benefit expenses for insured plans include the premium paid by the company. For a self-insured plan, these expenses include all
medical and drug claims paid by the plan, company contributions to medical accounts (FSA/HRA/HSA) and costs of administration minus employee
premium contributions. The annual change in costs is based on costs for active employees after plan and contribution changes. Respondents are
asked to report trends directly in the survey.
.