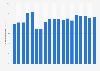
| Characteristic | Secondary education* | Tertiary education** |
|---|---|---|
| Luxembourg | 31,336 | 60,679 |
| Korea | 25,267 | 14,695 |
| Norway | 20,954 | 29,917 |
| Austria | 20,033 | 26,190 |
| Netherlands | 19,058 | 24,874 |
| Belgium | 18,681 | 25,989 |
| Australia | 18,247 | 25,162 |
| Germany | 17,962 | 23,269 |
| Iceland | 17,297 | 20,234 |
| United States | 16,301 | 36,274 |
| United Kingdom | 15,843 | 35,350 |
| Denmark | 15,838 | 29,680 |
| France | 15,530 | 21,379 |
| Sweden | 15,401 | 28,823 |
| Ireland | 14,633 | 24,241 |
| Finland | 14,213 | 20,456 |
| OECD average | 14,096 | 21,444 |
| Czechia | 13,995 | 17,221 |
| Portugal | 13,832 | 14,155 |
| Spain | 13,322 | 17,124 |
| Japan | 13,090 | 21,836 |
| Slovenia | 12,661 | 21,127 |
| Italy | 12,622 | 14,713 |
| Israel | 12,372 | 11,815 |
| New Zealand | 12,154 | 18,729 |
| Estonia | 10,093 | 19,011 |
| Lithuania | 10,083 | 15,950 |
| Poland | 9,947 | 15,897 |
| Slovak Republic | 9,492 | 19,178 |
| Latvia | 8,846 | 12,416 |
| Greece | 8,339 | 5,620 |
| Hungary | 7,987 | 20,476 |
| Chile | 6,991 | 11,639 |
| Turkey | 4,087 | 10,825 |
| Mexico | 3,422 | 7,519 |
| Canada | - | 27,582 |
The chart is not accessible to screen readers. Please switch to the table view to access the data.
Loading statistic...
Download
Source
Source
Release date
November 2025
More information
Region
OECD
Survey time period
2022
Supplementary notes
Expenditure in equivalent U.S. dollars converted using PPPs for GDP.聽
Data is based on full-time equivalent students.
*Data for secondary education includes lower and upper secondary.
**Data for tertiary education include R&D expenditures.
Citation formats