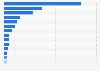
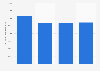
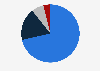
| Characteristic | Removals | Imports | Exports | Apparent consumption |
|---|---|---|---|---|
| 2022 | 526,355 | 4,111 | 11,171 | 519,295 |
| 2021 | 526,231 | 4,242 | 13,634 | 516,838 |
| 2020 | 510,243 | 5,683 | 13,348 | 502,577 |
| 2019 | 527,519 | 5,686 | 15,469 | 517,736 |
| 2018 | 548,139 | 6,910 | 20,764 | 534,285 |
| 2017 | 531,598 | 5,447 | 19,601 | 517,444 |
| 2016 | 511,280 | 7,433 | 20,219 | 513,350 |
| 2015 | 506,036 | 5,810 | 17,561 | 494,286 |
| 2014 | 505,637 | 5,171 | 20,658 | 490,150 |
| 2013 | 462,188 | 5,917 | 22,193 | 445,912 |
| 2012 | 461,151 | 5,917 | 22,132 | 444,936 |
| 2011 | 444,388 | 5,233 | 16,230 | 433,392 |
| 2010 | 465,999 | 5,740 | 13,967 | 457,771 |
The chart is not accessible to screen readers. Please switch to the table view to access the data.
Loading statistic...
Download
Source
Sources
Release date
August 2023
More information
Region
North America
Survey time period
2010 to 2022
Supplementary notes
'Apparent consumption' is calculated by adding imports to a country鈥檚 production and subtracting exports. Apparent consumption volumes are not adjusted for levels of stocks. It is synonymous with 'demand'.
This statistic has been produced using several editions of the report.
Citation formats