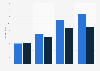
| Characteristic | Longer travel time relative to uncongested traffic |
|---|---|
| - | - |
| - | - |
| - | - |
| - | - |
| - | - |
| - | - |
| - | - |
| - | - |
| - | - |
| - | - |
The chart is not accessible to screen readers. Please switch to the table view to access the data.
Download
Source
More information
Region
North America
Survey time period
2023
Supplementary notes
TomTom used GPS data to compare travel times during the whole day and during peak periods to travel times during non-congested periods.
Includes cities with a population of 800,000 or over.
The figures are based on 2023 TomTom traffic data.
Citation formats