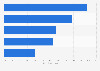
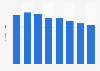
| City | Score |
|---|---|
| Calgary | 94.1 |
| Boston | 91.8 |
| New York City | 88.8 |
| Minneapolis | 88.2 |
| San Francisco | 87.4 |
| Vancouver | 86.6 |
| Denver | 85.6 |
| Ottawa | 84.9 |
| Charlotte | 84.8 |
| Toronto | 83.5 |
The chart is not accessible to screen readers. Please switch to the table view to access the data.
North America
2010
* Based on a scale of zero to 100.
According to the source, the index measures the environmental performance of 27 major cities in the U.S. and Canada. It is a composite of 31 indicators (CO2 emissions per unit of GDP, CO2 emissions per person, CO2 reduction strategy, electricity consumption per unit of GDP, electricity consumption per person, clean and efficient energy policies, green spaces, population density, green land use policies, urban sprawl, number of LEED-certified buildings, energy efficient standards, energy efficient building incentives, share of workers travelling by public transit, bicycle, or foot, public transport supply, average commute time from residence to work, green transport promotion, congestion reduction policies, water consumption per capita, water system leakages, water quality policy, stormwater management policy, percent of municipal solid waste recycled, waste reduction policies, nitrogen oxides emissions, sulphur dioxide emissions, PM10 emissions, clean air policy, green action plan, green management, public participation in green policy), based on nine categories (CO2, energy, land use, buildings, transport, water, waste, air quality, environmental governance). Each indicator was aggregated according to an assigned weighting. The category scores were then rebased on a scale of zero to 100. Moreover, each of the nine category scores were assigned an equal weighting (multiplied by 11.1 percent) and summed for a final score on a scale of zero to 100.