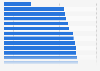
| Characteristic | Share of respondents |
|---|---|
| - | - |
| - | - |
| - | - |
| - | - |
| - | - |
| - | - |
| - | - |
| - | - |
| - | - |
| - | - |
The chart is not accessible to screen readers. Please switch to the table view to access the data.
Download
Source
Source
Release date
March 2012
More information
Region
United States
Survey time period
January to December 2011
Age group
8-19 years
Method of interview
Telephone interview
Supplementary notes
The source does not provide original wording of the question, the wording selected here may differ somewhat. This statistic only displays those respondents who answered in the affirmative.
According to the source, 353,492 people in all fifty states and Washington D.C, encompassing 190 metropolitan areas, were surveyed. This statistic however, displays only the first ten areas. The exact number of respondents for these areas was not provided.
Citation formats