| Characteristic | 16-24 years | 25-34 years | 35-44 years | 45-54 years | 55+ years |
|---|---|---|---|---|---|
| - | - | - | - | - | - |
| - | - | - | - | - | - |
| - | - | - | - | - | - |
| - | - | - | - | - | - |
| - | - | - | - | - | - |
| - | - | - | - | - | - |
| - | - | - | - | - | - |
| - | - | - | - | - | - |
| - | - | - | - | - | - |
The chart is not accessible to screen readers. Please switch to the table view to access the data.
Download
Source
Source
In cooperation with
Rakuten Insight
Release date
July 2025
More information
Region
Indonesia
Survey time period
May 8 to 30, 2025
Number of respondents
9,225
Age group
16 years and older
Special properties
among people who consumed media
Method of interview
Online survey
Supplementary notes
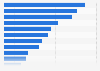
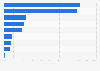
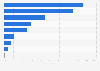
Survey question: "What are your reasons for consuming media? (choose up to 3 of the most relevant answers)"
Up to three answers were accepted.
Respondents count by age group was as follows:
16-24 years: 2,273聽
25-34 years: 3,032聽
35-44 years: 2,274聽
45-54 years: 1,233聽
55+ years: 413聽
Citation formats