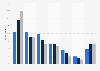
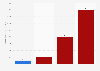
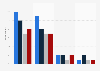
| Characteristic | Investment purposes | Payment purposes | Both | Refusal/Don't know |
|---|---|---|---|---|
| Netherlands | 89.61% | 1.99% | 4.45% | 3.94% |
| Germany | 82.31% | 6.05% | 10.58% | 1.06% |
| Slovakia | 78.91% | 10.36% | 8.54% | 2.18% |
| Estonia | 76.81% | 14.75% | 8.44% | 0% |
| Luxembourg | 71.36% | 11.2% | 15.49% | 1.95% |
| Greece | 70.37% | 10.92% | 18.24% | 0.47% |
| Ireland | 67.73% | 9.7% | 22.57% | 0% |
| Malta | 67.56% | 21.12% | 11.32% | 0% |
| Finland | 66.11% | 6.52% | 25.8% | 1.57% |
| Austria | 64.02% | 10.64% | 24.16% | 1.18% |
| Portugal | 63.21% | 15.05% | 21.74% | 0% |
| Cyprus | 61.38% | 9.17% | 28.6% | 0.84% |
| Slovenia | 61.3% | 14.8% | 18.1% | 5.79% |
| Croatia | 60.63% | 20.13% | 18.85% | 0.39% |
| Spain | 57.46% | 18.95% | 19.77% | 3.82% |
| France | 57.1% | 24.92% | 16.59% | 1.39% |
| Latvia | 56.77% | 16.11% | 25.26% | 1.86% |
| Belgium | 54.24% | 14.95% | 28.51% | 2.29% |
| Italy | 53.8% | 19.55% | 26.65% | 0% |
| Lithuania | 51.13% | 19.03% | 29.85% | 0% |
The chart is not accessible to screen readers. Please switch to the table view to access the data.
Loading statistic...
Download
Source
Source
Release date
December 2024
More information
Region
Europe
Survey time period
September to November 2023; April to June 2024
Number of respondents
50,000 respondents
Age group
18 years and older
Special properties
Consumers
Method of interview
Online survey
Supplementary notes
The survey respondents were weighted to a representative sample.
As this survey focuses on the euro area, the source did not include the United Kingdom.
The source phrased the survey question as follows: "Are your crypto assets for investment or payment purposes, or both?" Respondents had to option to choose either "denial" or "do not know", which the source put together in the final results.
Citation formats