
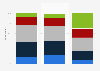
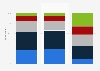


| Characteristic | Share of time spent |
|---|---|
| - | - |
| - | - |
| - | - |
| - | - |
The chart is not accessible to screen readers. Please switch to the table view to access the data.
Download
Source
Source
In cooperation with
Hub Entertainment Research
Release date
January 2025
More information
Region
United States
Survey time period
December 2024
Number of respondents
1,307 respondents
Age group
13-74 years
Method of interview
Online survey
Supplementary notes
Original question: 鈥淭hink about the time you spend watching non-premium online videos. How is that time allocated across devices?鈥�
Citation formats



