| Characteristic | Sales in million U.S. dollars |
|---|---|
| - | - |
| - | - |
| - | - |
The chart is not accessible to screen readers. Please switch to the table view to access the data.
April 2023
United States
2022
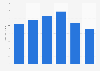
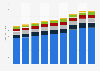
The source notes about its methodology: "Source: Food service sales are extrapolated for the total U.S. food service market by multiplying Circana鈥檚 41 percent coverage estimate by a multiplier of 2.4 to reach an estimated 100 percent. Food service sales shown are at the wholesale, distributor to operator level, not point-of-sale. Retail and e-commerce sales are not multiplied by and do not necessarily represent 100 percent coverage. The retail data presented in this graph is based on custom GFI and PBFA plant-based categories that were created by refining standard SPINS categories. Due to the custom nature of these categories, the presented data will not align with standard SPINS categories.
Source: Retail - SPINS Natural Grocery Channel, SPINS Conventional Multi Outlet Channel (powered by Circana, formerly IRI & NPD) | 52 Weeks Ending 1/1/2023. Ecommerce 鈥� NPC, All Outlets 52 weeks ending 1/1/2023. Food service 鈥� Circana, formerly IRI & NPD/SupplyTrack, 12 ME Dec 2022. "