| Characteristic | I am not impacted at all | I need to be cautious of my expenses | I am significantly impacted by rising prices | I am unable to cope with inflation |
|---|---|---|---|---|
| - | - | - | - | - |
| - | - | - | - | - |
| - | - | - | - | - |
| - | - | - | - | - |
| - | - | - | - | - |
| - | - | - | - | - |
| - | - | - | - | - |
| - | - | - | - | - |
| - | - | - | - | - |
| - | - | - | - | - |
| - | - | - | - | - |
| - | - | - | - | - |
The chart is not accessible to screen readers. Please switch to the table view to access the data.
Download
Source
Source
In cooperation with
Rakuten Insight
Release date
April 2023
More information
Region
Asia
Survey time period
March 9 to 31, 2023
Number of respondents
129,202 respondents
Age group
16 years and above
Method of interview
Online survey
Supplementary notes
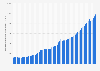
Survey question: "To what degree is your household impacted by inflation?"
Number of respondents:
China - 8,375;
Hong Kong - 3,542;
Indonesia - 12,948;
India - 34,431;
Japan - 1,393;
South Korea - 7,506;
Malaysia - 11,311;
the Philippines - 12,415;
Singapore - 6,821;
Thailand - 14,647;
Taiwan - 12,555;
and Vietnam - 3,258.
Figures might not add up to 100 percent due to rounding up.
Citation formats