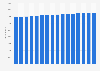
| Characteristic | 2020 | 2021 | 2022 | 2023 | Maximum capacity |
|---|---|---|---|---|---|
| - | - | - | - | - | - |
| - | - | - | - | - | - |
| - | - | - | - | - | - |
| - | - | - | - | - | - |
| - | - | - | - | - | - |
| - | - | - | - | - | - |
| - | - | - | - | - | - |
| - | - | - | - | - | - |
| - | - | - | - | - | - |
| - | - | - | - | - | - |
| - | - | - | - | - | - |
| - | - | - | - | - | - |
The chart is not accessible to screen readers. Please switch to the table view to access the data.
Download
Source
Sources
Release date
February 2024
More information
Region
United States
Survey time period
January 2020 to December 2023
Supplementary notes
This statistic has been compiled from multiple annual releases.
Due to changing Lake Mead elevations, Hoover鈥檚 generator capacity is adjusted based on estimated effective capacity and plant availability. The estimated effective capacity is based on projected Lake Mead elevations. Unit capacity tests will be performed as the lake elevation changes. This study reflects these changes in the projections.
Citation formats