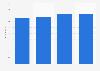
| Characteristic | Installed capacity in gigawatts |
|---|---|
| - | - |
| - | - |
| - | - |
| - | - |
| - | - |
| - | - |
| - | - |
| - | - |
| - | - |
| - | - |
| - | - |
| - | - |
| - | - |
| - | - |
| - | - |
| - | - |
| - | - |
| - | - |
| - | - |
| - | - |
| - | - |
| - | - |
The chart is not accessible to screen readers. Please switch to the table view to access the data.
Download
Source
Source
Release date
April 2024
More information
Region
Worldwide
Survey time period
2022
Supplementary notes
Hydropower facilities with capacities up to 10 megawatts.
*A discrepancy exists within the source between the stated global small hydropower capacity of 79 GW and the summed regional total derived from the data.
Citation formats