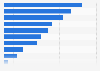
| Characteristic | Share of respondents |
|---|---|
| Christmas tree | 91% |
| Christmas lights | 49% |
| Nativity scene | 43% |
| Christmas ornaments | 41% |
| Christmas wreath | 22% |
| Christmas stockings | 9% |
| Garland | 9% |
| Mistletoe | 5% |
| Red velvet ribbon bows | 5% |
| Tinsel | 5% |
| Nutcracker | 3% |
| Christmas linens | 3% |
| Fake snow | 2% |
The chart is not accessible to screen readers. Please switch to the table view to access the data.
Loading statistic...
Download
Source
Sources
Release date
December 2022
More information
Region
Italy
Survey time period
October 2022
Number of respondents
17,540*
Supplementary notes
* There were more than 1,000 respondents per country. The surveyed countries were U.S., Canada, UK, Ireland, Australia, Germany, Austria, Netherlands, Belgium, France, Poland, Spain, Portugal, Italy, Sweden, Norway, and Finland.
Consumers were asked what their favorite or most important decoration is.
Date of access has been used for the date of release.
Citation formats