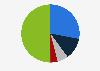
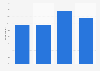
| Characteristic | Share of consumers who preferring attending outdoor events |
|---|---|
| Price | 40% |
| Proximity to the action | 26% |
| Location of the venue | 25% |
| Value for money of ticket | 21% |
| Interest in the event or participants | 20% |
| Location in the row (e.g. near the aisle) | 19% |
| Ease of travel to the venue | 16% |
| Seat size | 11% |
| Interest in the venue | 10% |
| Food and drinks for sale at the venue | 10% |
| Location of restrooms | 9% |
| Legroom | 9% |
| Recommendations online | 6% |
| Merchandise for sale at the venue | 5% |
| Recommendations offline | 4% |
| Don't know | 3% |
The chart is not accessible to screen readers. Please switch to the table view to access the data.
Loading statistic...
Download
Source
Source
In cooperation with
YouGov
Release date
January 2022
More information
Region
United States
Survey time period
December 2021
Special properties
Those who prefer attending outdoor events
Method of interview
Online panel
Supplementary notes
The source adds the following information regarding methodology: "YouGov Profiles is based on continuously collected data and rolling surveys, rather than from a single limited questionnaire. YouGov Profiles data is nationally representative and weighted by age, gender, education, region, and race."
Citation formats