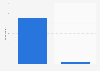
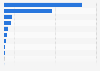
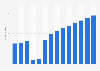
| Characteristic | Fair* | Don't know | Unfair* |
|---|---|---|---|
| - | - | - | - |
| - | - | - | - |
| - | - | - | - |
| - | - | - | - |
| - | - | - | - |
| - | - | - | - |
| - | - | - | - |
| - | - | - | - |
| - | - | - | - |
| - | - | - | - |
| - | - | - | - |
| - | - | - | - |
| - | - | - | - |
| - | - | - | - |
| - | - | - | - |
| - | - | - | - |
| - | - | - | - |
The chart is not accessible to screen readers. Please switch to the table view to access the data.
Download
Source
Source
Release date
June 2024
More information
Region
Worldwide
Survey time period
April 2024
Number of respondents
**
Age group
18 years and older
Method of interview
Online survey
Supplementary notes
* 鈥淔air鈥� equals the share of adults who selected 鈥渧ery fair鈥� plus 鈥渟lightly fair鈥�. 鈥淯nfair鈥� equals the share of adults who selected 鈥渧ery unfair鈥� plus 鈥渟lightly unfair鈥�.
** The sample size varied between 511 and 2,054 for each country.
Citation formats