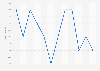
Indices < 100 = Decline; > 100 = Growth.
The source adds the following information regarding methodology: "The IRI CPG Demand Indexâ„¢ provides a standard metric for tracking changes in spending on consumer packaged goods. It measures weekly changes in consumer purchases, by dollar sales, against the year-ago period across departments including fixed and random weight products, grocery aisles and retail formats. The IRI CPG Demand Indexâ„¢ is available for eight U.S. regions and all U.S. states. Key drivers of demand changes namely, trips to the store and basket size (average spend per trip) are also provided. The IRI CPG Demand Indexâ„¢ is based on the full power of IRI's unparalleled data assets, including daily sales data reported from major chains' daily point-of-sale and e-commerce transactions of reporting retailers nationwide. It is updated daily with projections for the most recent week which are based on a proprietary, fully-automated forecasting solution."
The source did not provide an exact date of release. Date of access is used in this statistic in lieu of date of release.
Citation formats
Consumer demand in home care products in the United States 2021
Since late August 2021, consumer demand in home care products as reported by multi-outlet and convenience retailers in the United States was generally high until the last week of October, when demand fell below the baseline of 100. In the week ending *, consumer demand in home care products was reported as **. According to the source, an index level below 100 indicated decline.
Profit from the additional features of your individual account
Currently, you are using a shared account. To use individual functions (e.g., mark statistics as favourites, set
statistic alerts) please log in with your personal account.
If you are an admin, please authenticate by logging in again.
Learn more about how ÌÇÐÄÆÆ½â°æ can support your business.
IRI. (November 29, 2021). Weekly consumer demand level in home care products in retail stores in the United States from August to November 2021, as an index [Graph]. In ÌÇÐÄÆÆ½â°æ. Retrieved August 05, 2026, from /statistics/1278971/home-care-retail-products-demand-levels-united-states/
IRI. "Weekly consumer demand level in home care products in retail stores in the United States from August to November 2021, as an index." Chart. November 29, 2021. ÌÇÐÄÆÆ½â°æ. Accessed August 05, 2026. /statistics/1278971/home-care-retail-products-demand-levels-united-states/
IRI. (2021). Weekly consumer demand level in home care products in retail stores in the United States from August to November 2021, as an index. ÌÇÐÄÆÆ½â°æ. ÌÇÐÄÆÆ½â°æ Inc.. Accessed: August 05, 2026. /statistics/1278971/home-care-retail-products-demand-levels-united-states/
IRI. "Weekly Consumer Demand Level in Home Care Products in Retail Stores in The United States from August to November 2021, as An Index." ÌÇÐÄÆÆ½â°æ, ÌÇÐÄÆÆ½â°æ Inc., 29 Nov 2021, /statistics/1278971/home-care-retail-products-demand-levels-united-states/
IRI, Weekly consumer demand level in home care products in retail stores in the United States from August to November 2021, as an index ÌÇÐÄÆÆ½â°æ, /statistics/1278971/home-care-retail-products-demand-levels-united-states/ (last visited August 05, 2026)
Weekly consumer demand level in home care products in retail stores in the United States from August to November 2021, as an index [Graph], IRI, November 29, 2021. [Online]. Available: /statistics/1278971/home-care-retail-products-demand-levels-united-states/