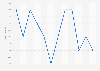
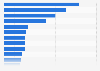
| Characteristic | Demand level as an index |
|---|---|
| - | - |
| - | - |
| - | - |
| - | - |
| - | - |
| - | - |
| - | - |
| - | - |
| - | - |
| - | - |
| - | - |
| - | - |
The chart is not accessible to screen readers. Please switch to the table view to access the data.
Download
Source
Source
Release date
November 2021
More information
Region
United States
Survey time period
August 29 to November 14, 2021
Supplementary notes
Indices < 100 = Decline; > 100 = Growth.
The source adds the following information regarding methodology: "The IRI CPG Demand Index鈩� provides a standard metric for tracking changes in spending on consumer packaged goods. It measures weekly changes in consumer purchases, by dollar sales, against the year-ago period across departments including fixed and random weight products, grocery aisles and retail formats. The IRI CPG Demand Index鈩� is available for eight U.S. regions and all U.S. states. Key drivers of demand changes namely, trips to the store and basket size (average spend per trip) are also provided. The IRI CPG Demand Index鈩� is based on the full power of IRI's unparalleled data assets, including daily sales data reported from major chains' daily point-of-sale and e-commerce transactions of reporting retailers nationwide. It is updated daily with projections for the most recent week which are based on a proprietary, fully-automated forecasting solution."
The source did not provide an exact date of release. Date of access is used in this statistic in lieu of date of release.
Citation formats