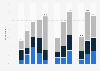
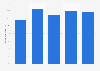
| Characteristic | Number of FTEs |
|---|---|
| - | - |
| - | - |
| - | - |
| - | - |
| - | - |
| - | - |
| - | - |
| - | - |
The chart is not accessible to screen readers. Please switch to the table view to access the data.
Download
Source
Source
Release date
October 2020
More information
Region
Worldwide
Survey time period
2012 to 2019
Special properties
Headcount as of December 31 of each respective year.
Supplementary notes
Previous figures were taken from previous editions of the same report.
FTE stands for full-time equivalent.
Citation formats