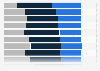
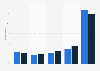
| Characteristic | Spend willingness quotient |
|---|---|
| - | - |
| - | - |
| - | - |
| - | - |
| - | - |
| - | - |
| - | - |
| - | - |
| - | - |
| - | - |
| - | - |
The chart is not accessible to screen readers. Please switch to the table view to access the data.
Download
Source
Source
Release date
May 2020
More information
Region
India
Survey time period
May 2020
Number of respondents
1,726 respondents
Age group
18-60
Special properties
respondents from 24 cities, 8 metro cities: equitable male-to-female ratio
Supplementary notes
*only women asked (845 respondents).
The quotient refers to the percentage of respondents, who are willing to spend on the respective categories.
Citation formats