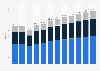
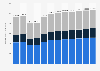
| Characteristic | Year-on-year decrease |
|---|---|
| - | - |
| - | - |
| - | - |
| - | - |
The chart is not accessible to screen readers. Please switch to the table view to access the data.
Download
Source
Source
Release date
May 2020
More information
Region
China
Survey time period
April 30, 2020 to May 12, 2020
Number of respondents
1,000 respondents
Age group
20 years and older
Special properties
among consumers who bought apparel and footwear products in 2019
Supplementary notes
The survey was conducted among 50 percent of female respondents and 50 percent male respondents.
30 percent of respondents were from Tier 1 cities, 35 percent were from Tier 2 cities, and 35 percent of respondents were from Tier 3 and below cities.
Around nine percent of respondents had a monthly household income of less than 5,000 yuan, 36 percent of respondents earned monthly between 5,000 and 15,000 yuan, 32 percent earned between 15,000 and 25,000 yuan. Around 23 percent of respondents had a monthly income of more than 25,000 yuan.
33 percent of respondents were between 20 and 29 years old, 33 percent of respondents were between 30 and 39 years old, and 33 percent of respondents were above 40 years old.
Citation formats