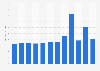
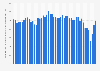
| Characteristic | Proportion of all employees |
|---|---|
| Sweden | 3.61% |
| Portugal | 3.95% |
| Finland | 5.03% |
| Italy | 8.46% |
| France | 8.61% |
| Denmark | 8.69% |
| Norway | 8.71% |
| Iceland | 11.16% |
| Luxembourg | 11.38% |
| Hungary | 11.61% |
| Belgium | 13.68% |
| Spain | 14.33% |
| Austria | 14.75% |
| Czechia | 15.09% |
| EU27 | 15.22% |
| Malta | 15.51% |
| Slovakia | 16.01% |
| Slovenia | 16.52% |
| United Kingdom | 16.98% |
| Serbia | 17.81% |
| Netherlands | 18.24% |
| Croatia | 18.42% |
| Cyprus | 18.73% |
| Greece | 19.65% |
| Ireland | 19.78% |
| Romania | 20.01% |
| Germany | 20.68% |
| Bulgaria | 21.41% |
| Poland | 21.87% |
| Estonia | 21.95% |
| Lithuania | 22.33% |
| Albania | 23.04% |
| Latvia | 23.49% |
The chart is not accessible to screen readers. Please switch to the table view to access the data.
Loading statistic...
Download
Source
Source
Release date
January 2021
More information
Region
Europe
Survey time period
2018
Supplementary notes
*Data is for 2014
Data for this statistic was compiled using earnings based on local units and enterprises, and provides information on employees in enterprises consisting of 10 or more employees.
Citation formats