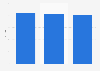
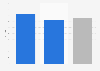
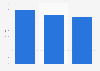
| Characteristic | Samsung | Apple | Motorola (Lenovo) | LG | All others | |
|---|---|---|---|---|---|---|
| - | - | - | - | - | - | - |
| - | - | - | - | - | - | - |
| - | - | - | - | - | - | - |
| - | - | - | - | - | - | - |
| - | - | - | - | - | - | - |
| - | - | - | - | - | - | - |
| - | - | - | - | - | - | - |
| - | - | - | - | - | - | - |
| - | - | - | - | - | - | - |
The chart is not accessible to screen readers. Please switch to the table view to access the data.
础颁厂滨庐
May 2026
United States
2018 to 2026
26,963 respondents
Email survey
Scores are reported on a scale of 0 to 100.
The source provides the following information: " Customers are asked to evaluate their recent experiences with the largest companies in terms of market share, plus an aggregate category consisting of 鈥渁ll other鈥濃�� and thus smaller鈥攃ompanies. ACSI survey data are used as inputs to the Index鈥檚 cause-and-effect econometric model, which estimates customer satisfaction as the result of the survey-measured inputs of customer expectations, perceptions of quality, and perceptions of value. The ACSI model, in turn, links customer satisfaction with the survey-measured outcomes of customer complaints and customer loyalty. ACSI clients receive confidential industry-competitive and best-in-class data on all modeled variables and customer experience benchmarks."