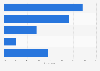
| Characteristic | Enirely positive | Mostly positive | Mostly negative | Very negative | It's difficult to say |
|---|---|---|---|---|---|
| Mar. 2019 | 18% | 52% | 14% | 5% | 11% |
| Mar. 2016 | 8% | 46% | 24% | 6% | 17% |
| Dec. 2014 | 16% | 36% | 21% | 9% | 19% |
| Feb. 2013 | 9% | 40% | 22% | 10% | 19% |
| Mar. 2011 | 8% | 37% | 25% | 10% | 20% |
| Dec. 2010 | 11% | 40% | 21% | 9% | 19% |
| Dec. 2009 | 10% | 39% | 23% | 9% | 19% |
| Oct. 2008 | 8% | 33% | 27% | 10% | 21% |
| Feb. 2008 | 10% | 29% | 25% | 13% | 22% |
| Dec. 2006 | 9% | 33% | 26% | 11% | 22% |
| Mar. 2003 | 18% | 35% | 21% | 12% | 14% |
The chart is not accessible to screen readers. Please switch to the table view to access the data.
Loading statistic...
Download
Source
Source
Release date
April 2019
More information
Region
Russia
Survey time period
2003 to 2019
Number of respondents
1,600 respondents
Age group
18 years and older
Method of interview
Face-to-face interviews, telephone interviews
Supplementary notes
* The survey was conducted in 137 different localities of 50 regions of Russian Federation.
The question in the survey was the following: "In your opinion, what role did Stalin play in the history of Russia?"
The source does not provide any information regarding missing percentage points to 100 percent, they are probably due to rounding.
Citation formats