


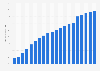

| Characteristic | Mobile phone | Television | Computer (total) | Game console | Other devices |
|---|---|---|---|---|---|
| 2015 | 89% | 13% | 65% | 8% | - |
| 2016 | 93% | 17% | 57% | 8% | - |
| 2017 | 96% | 22% | 51% | 9% | - |
| 2018 | 97% | 30% | 43% | 9% | - |
| 2019 | 99% | 37% | 42% | 9% | - |
| 2020 | 99% | 44% | 42% | 10% | - |
| 2021 | 99% | 50% | 36% | 9% | 1% |
| 2022 | 99% | 55% | 38% | 10% | 1% |
| 2023 | 99% | 58% | 42% | 10% | 1% |
| 2024 | 100% | 60% | 40% | 10% | 1% |
The chart is not accessible to screen readers. Please switch to the table view to access the data.
Loading statistic...
Download
Source
Sources
Release date
October 2024
More information
Region
Brazil
Survey time period
2015 to 2024
Number of respondents
21.170*
Age group
10 years and older
Special properties
individuals who accessed internet at least once in the past 3 months
Method of interview
Face-to-face interview
Supplementary notes
* Counting of surveyed individuals for 2024. Preceding figures come from earlier releases.聽
Data for 2024 was collected between March to August 2024.
Data for 2023 was collected between March to July 2023.
Data for 2022 was collected between October 2021 and March 2022.
Data for 2021 was collected between October 2020 and May 2021.
Data for 2020 was collected between October 2019 and March 2020.
Data for 2019 was collected between October 2018 and March 2019.
Data for 2018 was collected between November 2017 and May 2018.
Citation formats



