

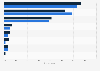


| Characteristic | Share of respondents |
|---|---|
| Political views | 55% |
| Any protected class | 35% |
| Physical appearance | 35% |
| Race and ethnicity | 25% |
| Gender | 25% |
| Religion | 21% |
| Occupation | 12% |
| Disability | 11% |
| Sexual orientation | 9% |
The chart is not accessible to screen readers. Please switch to the table view to access the data.
Loading statistic...
Download
Source
Sources
Release date
June 2020
More information
Region
United States
Survey time period
January 17, 2020 to January 30, 2020
Number of respondents
1,974 respondents
Age group
18 years and older
Method of interview
Online survey
Supplementary notes
Eight hundred and seventy-six surveys were collected to form a nationally representative base of respondents with additional oversamples from individuals who identified as Jewish, Muslim, African-American, Asian-American, Hispanic or Latino, or LGBTQ+. For the oversampled target groups, responses were collected until at least 200 Americans were represented from each of those groups. We oversampled the Jewish population until 500 Jewish Americans responded. Data was weighted on the basis of age, gender identity, race, census region, and education to adjust for national representation.
Multiple answers were possible.
Citation formats



