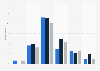
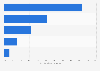
| Characteristic | Share of listings |
|---|---|
| - | - |
| - | - |
| - | - |
| - | - |
| - | - |
| - | - |
| - | - |
| - | - |
| - | - |
| - | - |
The chart is not accessible to screen readers. Please switch to the table view to access the data.
May 2018
United States
Q1 2018
The source adds the following information: "listings and searches were assigned starter, trade-up, and premium price categories based on the price cutoffs for each metro area. We define the price cutoffs of each segment based on home value estimates of the entire housing stock, not listing price. For example, we estimate the value of each single-family home and condo and divide these estimates into three groups: the lower third we classify as starter homes, the middle third as trade-up homes, and the upper third as premium homes. We classify a listing as a starter home on the market if its listing price falls below the price cutoff between starter and trade-up homes."