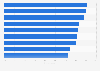
| Characteristic | Total score (index points) | Gaming environment | Internet quality & coverage | Gamer & developer opportunities |
|---|---|---|---|---|
| Irvine, CA | 73.63 | 1 | 1 | 5 |
| Austin, TX | 65.93 | 6 | 29 | 1 |
| San Francisco, CA | 64.88 | 5 | 27 | 3 |
| Seattle, WA | 62.81 | 8 | 23 | 4 |
| Orlando, FL | 59.52 | 3 | 52 | 6 |
| Anaheim, CA | 58.89 | 12 | 5 | 23 |
| Fremont, CA | 58.46 | 4 | 8 | 24 |
| San Diego, CA | 58.44 | 10 | 18 | 11 |
| Washington, DC | 57.98 | 13 | 4 | 20 |
| San Jose, CA | 57.71 | 15 | 14 | 12 |
| Los Angeles, CA | 57.67 | 19 | 63 | 2 |
| Raleigh, NC | 56.26 | 9 | 26 | 15 |
| Oakland, CA | 55.11 | 29 | 13 | 13 |
| Plano, TX | 54.09 | 18 | 9 | 38 |
| Madison, WI | 53.92 | 7 | 30 | 27 |
| Durham, NC | 53.79 | 27 | 15 | 17 |
| Denver, CO | 53.03 | 16 | 44 | 14 |
| Atlanta, GA | 52.85 | 11 | 85 | 7 |
| Portland, OR | 52.62 | 14 | 38 | 32 |
| New York, NY | 52.62 | 42 | 37 | 8 |
Download
Source
Source
Release date
June 2021
More information
Region
United States
Survey time period
2021
Number of respondents
100 respondents
Special properties
among the 100 largest U.S. cities
Supplementary notes
Score ranking is based on three key dimensions.
1: Gaming environment.
2: Internet quality and coverage.
3: Gamer and developer opportunities.
The dimensions were examined using 22 relevant metrics. Each metric was graded on a 100-point scale, with a score of 100 representing the most favorable conditions for gamers.
Citation formats