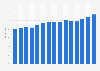
| Characteristic | Share of foreigners |
|---|---|
| 2024** | 14.8% |
| 2023 | 15.2% |
| 2022* | 14.6% |
| 2021 | 13.1% |
| 2020 | 12.7% |
| 2019 | 12.5% |
| 2018 | 12.2% |
| 2017 | 11.7% |
| 2016 | 11.2% |
| 2015 | 10.5% |
| 2014 | 9.3% |
| 2013 | 8.7% |
| 2012 | 8.3% |
| 2011 | 7.9% |
| 2010 | 8.8% |
| 2009 | 8.7% |
| 2008 | 8.8% |
| 2007 | 8.8% |
| 2006 | 8.8% |
| 2005 | 8.8% |
| 2004 | 8.8% |
| 2003 | 8.9% |
| 2002 | 8.9% |
| 2001 | 8.9% |
| 2000 | 8.8% |
| 1999 | 8.9% |
| 1998 | 8.9% |
| 1997 | 9% |
| 1996 | 9.1% |
| 1995 | 9% |
| 1994 | 8.7% |
| 1993 | 8.6% |
| 1992 | 8.2% |
| 1991 | 7.6% |
The chart is not accessible to screen readers. Please switch to the table view to access the data.
Loading statistic...
Download
Source
Source
Release date
April 2025
More information
Region
Germany
Survey time period
1991 to 2024
Special properties
Foreign population based on the population estimate as of December 31 of each year.
Supplementary notes
* The data for the years from 2011 onwards are based on the 2011 census, while the data from 2022 onwards are based on the 2022 census.
** The figure shows the proportion of the foreign population according to population projections as of December 31 of the respective years. The data for 2024 differs in that it is based on figures as of November 30.
Citation formats