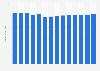
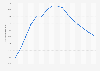
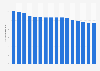
| Characteristic | Number of viewers in millions |
|---|---|
| - | - |
| - | - |
| - | - |
| - | - |
| - | - |
| - | - |
| - | - |
| - | - |
| - | - |
| - | - |
The chart is not accessible to screen readers. Please switch to the table view to access the data.
Download
Source
Source
Release date
June 2022
More information
Region
United States
Survey time period
2013, 2018 to 2021
Special properties
forecast data from February 2022; incl. cable, satellite, telecom/fiber operators, and MSOs
Supplementary notes
* Forecast.
The source defines non-pay TV viewers as those who no longer have access to traditional pay TV services or have never had access to traditional pay TV services.
Citation formats