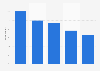
| Characteristic | Ownership rate |
|---|---|
| - | - |
| - | - |
| - | - |
| - | - |
| - | - |
| - | - |
| - | - |
| - | - |
| - | - |
| - | - |
| - | - |
The chart is not accessible to screen readers. Please switch to the table view to access the data.
Download
Source
Source
Release date
January 2025
More information
Region
South Korea
Survey time period
2014 to 2024
Number of respondents
4,006 respondents
Age group
6 years and older
Special properties
surveys were conducted in June and July for approx. 10 weeks each year
Method of interview
Face-to-face interview
Supplementary notes
Respondents count by year was as follows:
2014: 4,313
2015: 4,305
2016: 4,233
2017: 4,203
2018: 4,162
2019: 4,583
2020: 4,260
2021: 4,171
2022: 4,128
2023: 4,077
2024: 4,006
Citation formats