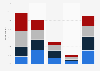
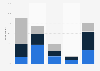
| Characteristic | Share of respondents |
|---|---|
| Email newsletters | 94% |
| Websites | 89% |
| News apps | 74% |
| Podcasts | 51% |
| Video | 46% |
The chart is not accessible to screen readers. Please switch to the table view to access the data.
December 2016
Worldwide
September and October 2016
1,357 respondents
The source adds the following information: "The respondent pool consisted of business leaders in 97 countries and 31 industries. C-level executives were the most highly represented group by job title (50% of respondents); others in the pool included managing partners, managing directors, VPs, directors, general managers, and board members. Industries represented include: consulting and business services (21% of respondents); finance (14%); media and advertising (13%); technology (11%); healthcare and life sciences (4%); retail and luxury goods (4%); and others (34%). The four largest industry segments were selected for this analysis. Distribution of respondents across age ranges was: under 25 (2%); 25-34 (13%); 35-44 (18%); 45-54 (26%); 55-64 (24%); 65 and older (16%)."