| Characteristic | 18 to 29 years | 30 to 39 years | 40 to 49 years | 50 to 59 years | 60 to 69 years | 70 years and more | Grand Total |
|---|---|---|---|---|---|---|---|
| - | - | - | - | - | - | - | - |
| - | - | - | - | - | - | - | - |
| - | - | - | - | - | - | - | - |
| - | - | - | - | - | - | - | - |
| - | - | - | - | - | - | - | - |
| - | - | - | - | - | - | - | - |
| - | - | - | - | - | - | - | - |
| - | - | - | - | - | - | - | - |
Download
Source
Sources
Release date
January 2017
More information
Region
United States
Survey time period
August 8 to 20, 2016
Number of respondents
n=940 respondents, users of coupons
Age group
18 years and older
Method of interview
Online survey
Supplementary notes
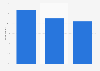
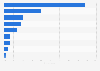
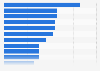
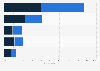
Original question: "Why do you use coupons?"
Total number of respondents by age:
18 to 29 years: 125
30 to 39 years: 129
40 to 49 years: 182
50 to 59 years: 225
60 to 69 years: 196
70 years and more: 83
Citation formats