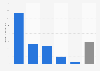
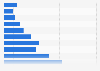
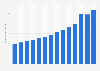
| Characteristic | Hospital care | Physician and clinical services | Prescription drugs | Nursing care* | Other** |
|---|---|---|---|---|---|
| 2024 | 31% | 21% | 8.8% | 4.2% | 35% |
| 2023 | 31.2% | 20.1% | 9.2% | 4.3% | 35.2% |
| 2022 | 30.4% | 20.1% | 8.9% | 4.3% | 36.3% |
| 2021 | 30.8% | 20.1% | 8.6% | 4.2% | 36.3% |
| 2020 | 30.5% | 19.6% | 8.4% | 4.7% | 36.8% |
| 2019 | 31.7% | 20.4% | 9% | 4.6% | 34.1% |
| 2018 | 31.2% | 20.4% | 9% | 4.7% | 34.7% |
| 2017 | 31.3% | 20.6% | 9.2% | 4.7% | 34.2% |
| 2016 | 31.3% | 20.5% | 9.5% | 4.9% | 33.8% |
| 2015 | 31.2% | 20.1% | 9.9% | 5% | 33.8% |
The chart is not accessible to screen readers. Please switch to the table view to access the data.
Loading statistic...
Download
Source
Source
Release date
January 2026
More information
Region
United States
Survey time period
2015 to 2024
Supplementary notes
* Nursing care facilities and continuing care retirement communities. Includes freestanding facilities only. Additional services of this type provided in hospital-based facilities are counted as hospital care.
** Includes: other professional services; dental services; home health care; other health, residential, and personal care; durable and other non-durable medical products; government administration; net cost of health insurance; government public health activities; investment
Citation formats