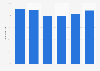
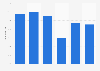
| Characteristic | Hospital occupancy rate |
|---|---|
| - | - |
| - | - |
| - | - |
| - | - |
| - | - |
| - | - |
| - | - |
| - | - |
| - | - |
| - | - |
| - | - |
| - | - |
| - | - |
| - | - |
| - | - |
| - | - |
| - | - |
| - | - |
| - | - |
| - | - |
| - | - |
| - | - |
| - | - |
| - | - |
| - | - |
| - | - |
| - | - |
| - | - |
| - | - |
| - | - |
| - | - |
| - | - |
| - | - |
| - | - |
| - | - |
| - | - |
| - | - |
| - | - |
| - | - |
| - | - |
| - | - |
| - | - |
| - | - |
| - | - |
| - | - |
| - | - |
| - | - |
| - | - |
| - | - |
| - | - |
| - | - |
| - | - |
| - | - |
| - | - |
| - | - |
| - | - |
| - | - |
| - | - |
| - | - |
| - | - |
| - | - |
| - | - |
| - | - |
The chart is not accessible to screen readers. Please switch to the table view to access the data.
Download
Source
Source
Release date
July 2024
More information
Region
United States
Survey time period
1960 to 2022
Supplementary notes
Release date represents the date figures were accessed.
The source adds the following:聽The curative (acute) care occupancy rate is calculated as the number of beds effectively occupied (bed-days) for curative care (HC.1 in SHA classification) divided by the number of beds available for curative care multiplied by 365 days, with the ratio multiplied by 100. Occupancy rate = Total number of bed-days during the year / (Number of beds available * 365 days) * 100
Citation formats