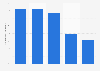
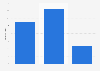
| Characteristic | Share of satisfied customers |
|---|---|
| - | - |
| - | - |
| - | - |
| - | - |
| - | - |
| - | - |
| - | - |
| - | - |
| - | - |
| - | - |
| - | - |
| - | - |
| - | - |
| - | - |
| - | - |
| - | - |
| - | - |
| - | - |
| - | - |
| - | - |
| - | - |
| - | - |
| - | - |
| - | - |
| - | - |
| - | - |
| - | - |
| - | - |
The chart is not accessible to screen readers. Please switch to the table view to access the data.
February 2018
United Kingdom (Great Britain)
Q1 2011 to Q4 2017
10,000+
*Customers were asked the question 'How satisfied are you with the service you get from your current supplier?鈥�. The question was asked separately for gas and electricity.
**In 2017, the methodology for results changed. The source adds "From 2017 these answer scales have changed. Overall satisfaction, ease of contact and ease of understanding bill are now asked on 7 point scales. For these metrics we now show the data for those who said extremely satisfied, very satisfied or fairly satisfied. Recommendation is now asked on a scale of 0-10. We are showing data for customers who said that their likelihood to recommend their supplier on a scale of 0-10 was 8 or above. The question on suppliers valuing customers has remained a 5 point scale and so the data presented remains the same (those who answered very satisfied or fairly satisfied). "