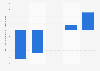


| Characteristic | Operating income in million U.S. dollars |
|---|---|
| Q2 '24 | 10 |
| Q1 '24 | 10 |
| Q4 '23 | 29 |
| Q3 '23 | 16 |
| Q2 '23 | 12 |
| Q1 '23 | -6 |
| Q4 '22 | 18 |
| Q2 '22 | 20 |
| Q1 '22 | 8.5 |
| Q4 '21 | 20.8 |
| Q3 '21 | 13.2 |
| Q2 '21 | 8.2 |
| Q1 '21 | 14 |
| Q4 '20 | 15.2 |
| Q3 '20 | 2.6 |
| Q2 '20 | -5.1 |
| Q1 '20 | 4.3 |
| Q4 '19 | 27 |
| Q3 '19 | 12.7 |
| Q2 '19 | 21.9 |
| Q1 '19 | 9 |
| Q4 '18 | 20 |
| Q3 '18 | 11.8 |
| Q2 '18 | 20.5 |
| Q1 '18 | 10.7 |
The chart is not accessible to screen readers. Please switch to the table view to access the data.
Loading statistic...
Download
Source
Source
Release date
August 2024
More information
Region
United States
Survey time period
Q1 2018 to Q2 2024
Special properties
formerly known as Ebates
Supplementary notes
Excludes rebranding cost of USD 36.3 million (Q1/19) ,USD 30.4 million (Q2/19) ,USD 20.4 million (Q3/19) ,USD 27.4 million (Q4/19), USD 5.2 million (Q1/20), USD 5.1 million (Q2/20) and USD 6.3 million (Q3/20), USD 2.5 million (Q4/20).
Operating income has changed due to change in method of internal cost allocation. Past figures have been retroactively adjusted.
Figures prior Q2 2019 were retrieved from previous publications.
Values have been rounded.
Data for Q3 2022 was not available.
Citation formats