| Characteristic | Share of respondents |
|---|---|
| - | - |
| - | - |
| - | - |
| - | - |
| - | - |
| - | - |
The chart is not accessible to screen readers. Please switch to the table view to access the data.
Download
Source
Source
Release date
March 2017
More information
Region
Europe
Survey time period
2015
Number of respondents
900*
Special properties
leading private bankers and wealth advisors*
Supplementary notes
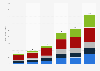
Original survey question was structured as follows: "On average, what percentage of your clients wealth is allocated to the following asset classes?"
* Figures created using Knight Franks annual attitudes survey.
Citation formats