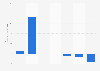
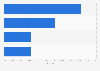
| Characteristic | Significantly higher customer frequency | Higher customer frequency | Stable customer frequency | Lower customer frequency | Significantly lower customer frequency |
|---|---|---|---|---|---|
| - | - | - | - | - | - |
| - | - | - | - | - | - |
| - | - | - | - | - | - |
| - | - | - | - | - | - |
| - | - | - | - | - | - |
| - | - | - | - | - | - |
| - | - | - | - | - | - |
| - | - | - | - | - | - |
| - | - | - | - | - | - |
| - | - | - | - | - | - |
The chart is not accessible to screen readers. Please switch to the table view to access the data.
Download
Source
Source
Release date
October 2025
More information
Region
Germany
Survey time period
2015 to 2025
Supplementary notes
* Figures preceding 2020 were recorded before the coronavirus (COVID-19) pandemic.
Figures preceding 2017 are based on earlier source information.
2021: no figures available from the source.
Citation formats