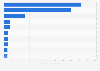
| Characteristic | Import value | Export value | Excess imports over exports |
|---|---|---|---|
| - | - | - | - |
| - | - | - | - |
| - | - | - | - |
| - | - | - | - |
| - | - | - | - |
| - | - | - | - |
| - | - | - | - |
| - | - | - | - |
| - | - | - | - |
| - | - | - | - |
| - | - | - | - |
| - | - | - | - |
| - | - | - | - |
| - | - | - | - |
| - | - | - | - |
| - | - | - | - |
The chart is not accessible to screen readers. Please switch to the table view to access the data.
Download
Source
Source
Release date
February 2024
More information
Region
Germany
Survey time period
2008 to 2023
Supplementary notes
Figures have been rounded.
To access this statistic, click the web link and type the code "51000-0005" into the search bar. Figures shown in this statistic refer to the aggregated numbers of the product groups WA 54 to 63 as well as 65 and 66. Figures exclude silk, wool, cotton and other natural fibers as well as shoes, but include umbrellas, canes etc.
Citation formats