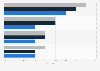
| Characteristic | Number of divorced people |
|---|---|
| 15 to 19 years | 27 |
| 20 to 24 years | 3,661 |
| 25 to 29 years | 23,303 |
| 30 to 34 years | 73,795 |
| 35 to 39 years | 138,610 |
| 40 to 44 years | 211,847 |
| 45 to 49 years | 274,686 |
| 50 to 54 years | 343,826 |
| 55 to 59 years | 420,741 |
| 60 to 64 years | 437,284 |
| 65 to 69 years | 364,469 |
| 70 to 74 years | 251,586 |
| 75 to 79 years | 138,247 |
| 80 to 84 years | 60,753 |
| 85 to 89 years | 24,705 |
| 90 to 94 years | 8,031 |
| 95 to 99 years | 1,623 |
| 100 years and over | 201 |
The chart is not accessible to screen readers. Please switch to the table view to access the data.
Loading statistic...
Download
Source
Source
Release date
November 2022
More information
Region
Canada
Survey time period
2022
Age group
15 years and over
Supplementary notes
Data presented here is by 'legal marital status' where persons living in common law.
Divorced includes persons who have obtained a legal divorce and have not remarried. Those who live with a common-law partner are included in this category.
Adapted from Statistics Canada, statcan.gc.ca, 2022. This does not constitute an endorsement by Statistics Canada of this product.
Citation formats