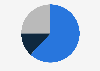
| Characteristic | Television | Written press | Radio | Internet* |
|---|---|---|---|---|
| - | - | - | - | - |
| - | - | - | - | - |
| - | - | - | - | - |
| - | - | - | - | - |
| - | - | - | - | - |
| - | - | - | - | - |
| - | - | - | - | - |
| - | - | - | - | - |
The chart is not accessible to screen readers. Please switch to the table view to access the data.
May 2019
EU
2011 to 2018**
27,424*
15 years and older
* n (2012) = 26,622, n (2013) = 27,829, n (2014) = 27,901, n (2015) = 27,681, n (2016) = 27,705, n (2017) = 28,055, n (2018) = 27,424
** Dates of survey were, November 2011, November 3-18, 2012, November 2-17, 2013, November 8-17, 2014, November 7-17, 2015 and November 3-16, 2016, November 5-19, 2017, November 8-22, 2018
This question was phrased by the source as follows: "Where do you get most of your news on European political matters?" Multiple answers possible. Internet total: aggregate of "websites" and "online social networks".
Figures for years prior to 2019 were published earlier by the source.