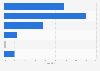
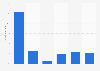
| Characteristic | Business | Personal |
|---|---|---|
| 2017 | 1,074 | 34,145 |
| 2016 | 980 | 32,440 |
| 2015 | 6,036 | 24,554 |
| 2014 | 8,967 | 20,684 |
| 2013* | 0 | 3,769 |
| 2012* | 0 | 2,476 |
The chart is not accessible to screen readers. Please switch to the table view to access the data.
December 2018
United Kingdom
2012 to 2017
156 respondents
Microcredit institutions
Online survey
* Data for business loans for the UK in 2012 and 2013 was collected from a different sample, resulting in figures that could not be displayed in the same statistic.
Additional information added directly by the source: "The 2014-15 EMN-MFC Survey involved a broad range of actors from 22 countries (14 EU Member States). Different regional development paths persist for MFIs in Western and Eastern Europe but also show signs of potential convergence.
Microloan providers use a variety of institutional models to operate in heterogeneous legal and regulatory frameworks: survey participants are
primarily non-bank financial institutions (60%) and NGOs (31%) but also
include other legal forms (i.e. commercial banks, cooperatives/credit unions,
government body).
The European microcredit sector, as depicted by the 149 surveyed MFIs, is
diverse, relatively young and dynamic. The majority of respondents (77%)
initiated their microlending activities after 1995. Approximately half of the
sample started lending activities between 1995-2004."